- Dynatrace Community
- Dynatrace
- Ask
- Open Q&A
- Re: Profiling CPU issues
- Subscribe to RSS Feed
- Mark Topic as New
- Mark Topic as Read
- Pin this Topic for Current User
- Printer Friendly Page
Profiling CPU issues
- Mark as New
- Subscribe to RSS Feed
- Permalink
30 Jan 2024
02:57 PM
- last edited on
07 Feb 2024
09:55 AM
by
![]() MaciejNeumann
MaciejNeumann
Hi,
I'm trying to profile some CPU spikes I got during the day on an Azure App Service.
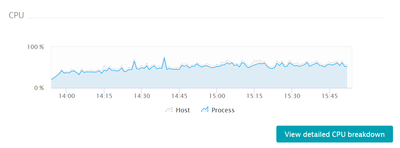
Here's basically the graph of the CPU consume over a single istance:
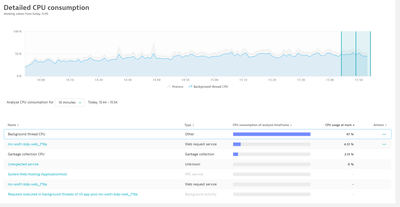
If I click View detailed CPU breakdown, I got this:
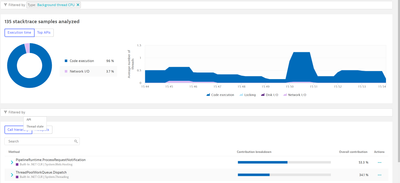
But it seems the most CPU usage is by "Background thread CPU"? Which (if I understand it correctly) related to PipelineRuntime.ProcessRequestNotification:
Which is the entry point of the dynatrace profiler 😮
Am I correct? It seems profiler introduce the main CPU analying it? Do I need to configure out somethings different?
Thanks
- Labels:
-
host monitoring
- Mark as New
- Subscribe to RSS Feed
- Permalink
05 Feb 2024 05:11 PM - edited 05 Feb 2024 05:17 PM
Is there any chance your application uses native libraries? Also, there are OneAgent features for .NET you might not have enabled (see OneAgent features enabled in your environment).
Anyway in .NET, Stack Traces are not collected very often, especially compared to Java applications. I'd recommend looking at a wider interval when analysing it with method hotspots. You have just 135 samples of stack traces in your timeframe and this is not enough for any conclusion.


