- Dynatrace Community
- Dynatrace
- Ask
- Open Q&A
- Traces on Grail: getting the "processing" time
- Subscribe to RSS Feed
- Mark Topic as New
- Mark Topic as Read
- Pin this Topic for Current User
- Printer Friendly Page
Traces on Grail: getting the "processing" time
- Mark as New
- Subscribe to RSS Feed
- Permalink
16 Apr 2024 03:55 PM
I was just asking myself how to get the overall processing time of a trace. In Grail spans and traces all have a duration field but there is no knowledge of what runs asynchronously or sequentially.
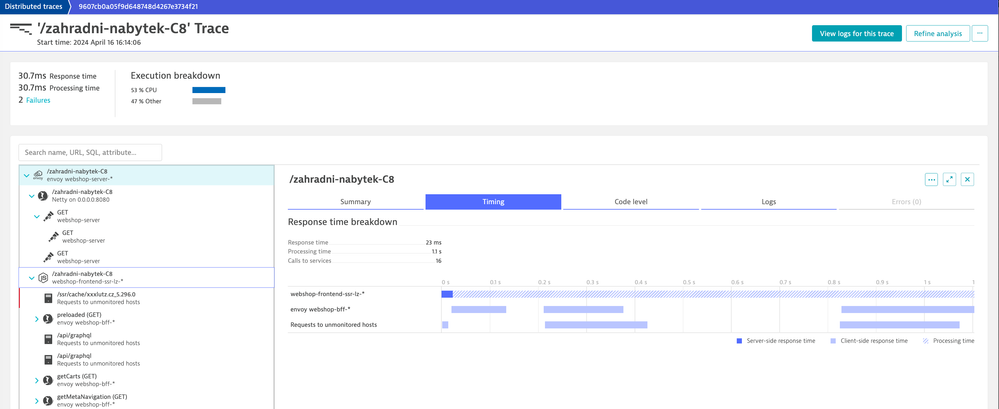
Imagine this trace in the UI:
With the async stuff going on the "response time" is 30.7ms. One can see this on the root span of the trace as well. But then there are a lot of async calls and the actual time I'd be interested is the "Processing time" which is ~1s.
If I want to know how much time is spent on a individual service int total I can't just sum up the "duration" of these service calls, neither can I add up all span durations for the overall duration of the trace?
Any ideas how to solve this? How could one get the duration/processing time of this trace using a query?
- Labels:
-
distributed traces

