- Dynatrace Community
- Dynatrace
- Ask
- Open Q&A
- Re: Trying to determine if Database server or requesting App Server is providing data for Trace and understand "Failed Reques
- Subscribe to RSS Feed
- Mark Topic as New
- Mark Topic as Read
- Pin this Topic for Current User
- Printer Friendly Page
- Mark as New
- Subscribe to RSS Feed
- Permalink
08 Sep 2023 07:47 PM
Hello:
I am trying to make sure I am reading a trace correctly. I had to redact some information for security purposes, but the stricture is the same in the trace. Please look at the images provided.
We have an agent on both the database and the application server.
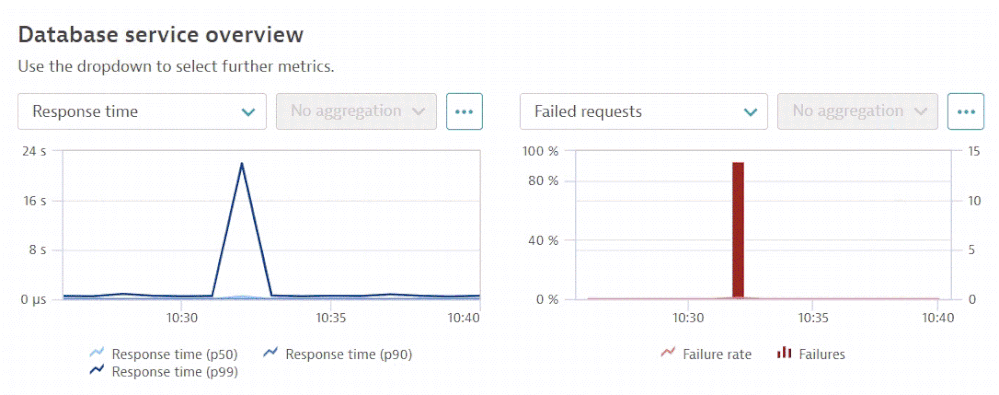
In the first image we see that the database lists "Failed Requests" (not failed connection)
1- Does this mean that the database server saw the request? Or is that information being populated from what Dynatrace gathered from the Application server (and then inserted it into the DB page/overview)
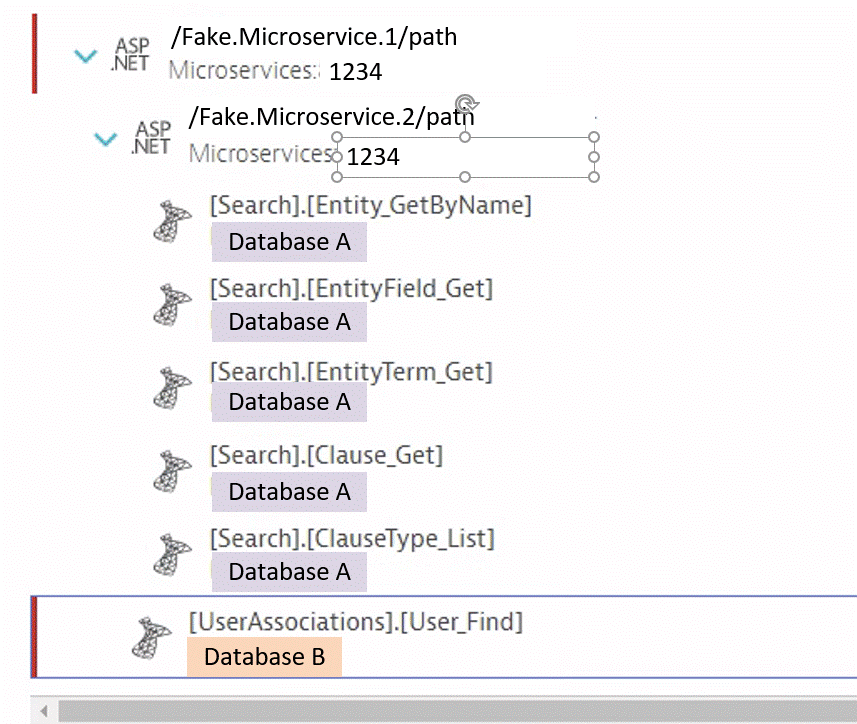
In the second image I dive into one of the failed requests "Failed Request" traces from the image above.
At the outermost layer is the Microservice.1 action.
I then see Microservice.2 action (indented 1 level) make several successful requests from Database A
Following that I see Database B attempt to be accessed. (and create an error)
That last action in indented 1 level less than the Database A actions.
So, does this mean it is part of Microservice.1 's actions?
If so, is it showing that Microservice.1 waited to access Database 2 until Microservice.2 was completed?
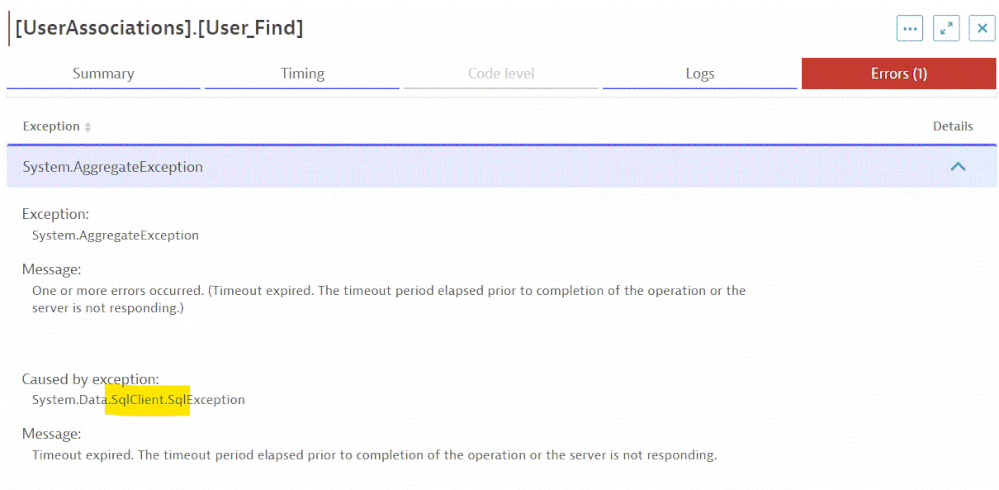
The last image is what shows up under the error message for trying to access Database B.
It says it is a SqlClient Exception, but was it generated from the database itself? Or from the Microservice attempting to access it?
Thank you all so much for any clarifications.
If you have any good suggestions for sources that delve into reading these traces with examples please share!
Kindest regards,
Chris
Solved! Go to Solution.
- Labels:
-
databases
-
distributed traces
- Mark as New
- Subscribe to RSS Feed
- Permalink
08 Sep 2023 07:57 PM
I believe the error is in the database, giving a timeout to process the request. Since the exception is in the database.
The oneagent in the database is only for infra-only monitoring.
The quality metrics are taken from the services that communicate with it. But if you look at the exception you can see that the request hit the database but took time to process
- Mark as New
- Subscribe to RSS Feed
- Permalink
11 Sep 2023 12:22 PM
Thank you Natanael. So when you say "The exception is in the database"
Are you saying that the exception listed was created from the SQL server and not the application server making the request?
When I see the icon/image of the MS SQL database next to the entry [UserAssociations].[User_find] is this telling me that the data is from the SQL server? (And not from the application server?)
In the case of a timeout, I guess it makes a difference as to who is reporting it. If the SQL server is the one reporting it, then we can safely say the message arrived. However, if the message is from the calling application server, then something may have happened on the way to the SQL server. Knowing which server is providing that information helps immensely.
Let me know which it is if you could and thanks!
- Mark as New
- Subscribe to RSS Feed
- Permalink
19 Sep 2023 06:33 PM - edited 19 Sep 2023 06:34 PM
Yes, I think the problem is in the sql server, with all the evidence you provide I come to that conclusion. You could try service backtrace or distributed trace to see if the component is taking longer to run. Feel free to ask if you got any doubts


