- Dynatrace Community
- Dynatrace
- Ask
- Real User Monitoring
- Browser / Network performance in Useraction analysis / Waterfalls
- Subscribe to RSS Feed
- Mark Topic as New
- Mark Topic as Read
- Pin this Topic for Current User
- Printer Friendly Page
Browser / Network performance in Useraction analysis / Waterfalls
- Mark as New
- Subscribe to RSS Feed
- Permalink
08 Jun 2023 02:54 PM
Hi community,
I've got a question about Real User Monitoring. When analyzing an useraction there are a lot of factors rendered in.
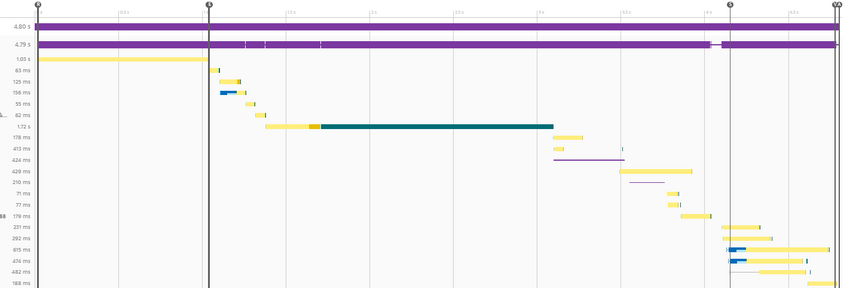
But what is the best way to analyze if the users "bad network" is causing the issue. I did some analysis and via Network Throttling and found out that especially the "Response" get's affected by bad network performance. An example of my normal user action timings:
When executing the same user action Throttled to 100Kbs, I see:
I've got a few question as a result of this behavior
- Does anybody has experience on this topic? How can we find / display slow network issues?
- Does a slow network connection / browser primarily result in a higher response time?
- Do we have any examples / experience on displaying the impact of network behavior on dashboards for Web Applications / Key user actions?
Kind regard,
Michiel
- Mark as New
- Subscribe to RSS Feed
- Permalink
08 Jun 2023 03:13 PM
Hello @michiel_otten
One of the Frontend time metrics can be considered in this scenario as well. It should cover the bandwidth issue from the data center and also the bad or slow network of the end-users as well. Especially, when there is a huge payload downloading on the end-users' side.
Regards,
Babar
- Mark as New
- Subscribe to RSS Feed
- Permalink
13 Jun 2023 08:08 AM
Hi,
Thanks for your answer. I see some metrics here, but is there an easy way to plot it on dashboards?
I see it is being saved per user action and the metric is probably build up using all the different resource vs. XHR actions.
But what if I want to show a summary of applications that are mostly impacted by bad browsers / bad end user network etcetera? Is this possible?
Regards,
Michiel


