Turn on suggestions
Auto-suggest helps you quickly narrow down your search results by suggesting possible matches as you type.
- Dynatrace Community
- Dynatrace
- Ask
- Real User Monitoring
- JavaScript Errors traces query
Options
- Subscribe to RSS Feed
- Mark Topic as New
- Mark Topic as Read
- Pin this Topic for Current User
- Printer Friendly Page
Options
- Mark as New
- Subscribe to RSS Feed
- Permalink
24 Jan 2024
04:26 PM
- last edited on
25 Jan 2024
12:58 PM
by
![]() MaciejNeumann
MaciejNeumann
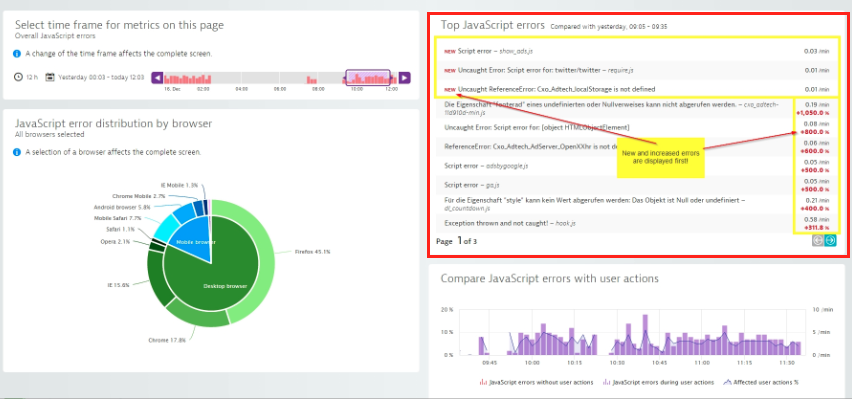
Hi there, I'm creating some queries on user sessions, so I can count the JS errors, but I can't get more details like the image
Could I get JS errors details on User Sessions?, or what do I need to do?
Basically we are migrating from other monitoring app to DT, currently we are using a query like this
SELECT count(errorMessage) FROM JavaScriptError FACET domain, errorMessage WHERE requestUri != '/web/chart'
and that is enough to grab all the JS errors with details
Solved! Go to Solution.
Labels:
image.png
186 KB
4 REPLIES 4
Options
- Mark as New
- Subscribe to RSS Feed
- Permalink
13 Feb 2024 12:19 AM
@AlexDev Yes, you can get the JS Error details on User Session page, select the Error Type from "Filter by" option

Thanks,
Tijust
Dynatrace Professional Certified
Options
- Mark as New
- Subscribe to RSS Feed
- Permalink
13 Feb 2024 05:16 AM
Hello @AlexDev
In simple way if you want to get JS error count.
Follow- Select your application --> scroll down --> under top errors --> select JavaScript

post click on JavaScript this view will be presented.
From here you can use filters and create your own metric

Cheers!
RN
Have a nice day!
Reply
Options
- Mark as New
- Subscribe to RSS Feed
- Permalink
13 Feb 2024 07:06 AM
This is the solution 🙂
Have a nice day!
Options
- Mark as New
- Subscribe to RSS Feed
- Permalink
13 Feb 2024 01:31 PM
Thanks😉
Have a nice day!
