- Dynatrace Community
- Dynatrace
- Ask
- Real User Monitoring
- Unexpected low traffic
- Subscribe to RSS Feed
- Mark Topic as New
- Mark Topic as Read
- Pin this Topic for Current User
- Printer Friendly Page
Unexpected low traffic
- Mark as New
- Subscribe to RSS Feed
- Permalink
11 Sep 2023
04:14 PM
- last edited on
15 Sep 2023
08:17 AM
by
![]() MaciejNeumann
MaciejNeumann
Hello everyone
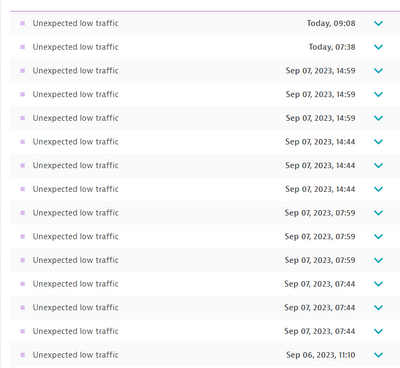
I am facing a problem of Unexpected low traffic completely every day.
When this problem occurs, inspecting the page through the browser and going to the network, I realize that the agent is not in the "ruxitagentjs" frontend. What could it be?
This problem usually stays for 1-2 hours on average and then returns normally. The root cause points to the application itself.
- Mark as New
- Subscribe to RSS Feed
- Permalink
11 Sep 2023 11:35 PM - edited 12 Sep 2023 12:14 AM
@Iplinsky , if a week ago everything is normal, and now the RUM Javascript is gone, it's normal to receive that error. I would try to figure out why the Javascript is gone.
- Mark as New
- Subscribe to RSS Feed
- Permalink
28 Sep 2023 03:51 PM
Exactly. I'm investigating why the agent's javascript isn't in the application, thus generating these Unexpected Traffic errors.
- Mark as New
- Subscribe to RSS Feed
- Permalink
14 Sep 2023 03:08 PM
The main question is whether the overall level of user actions on the RUM application level is dropping during the problem:
- If it's also dropping, then, as Antonio mentioned, we should debug why there is no RUM script in the HTML
- If overall user action levels are OK, it might be a geolocation issue, especially if your users are from private networks (192/172/10). The "Unexpected low traffic" alarm is sensitive to situations if the traffic drops in a particular location. If some private client addresses are not assigned to any location, then this alarm does not see traffic from these addresses, and it starts beeping ...
Please let us know which of these situations you're facing.
Adam Piotrowicz
Lead Technical Support Engineer at Dynatrace
- Mark as New
- Subscribe to RSS Feed
- Permalink
28 Sep 2023 07:50 AM
@Iplinsky an you provide @Adam-Piotrowicz more insights so he can help to solve the issue? 🙂
- Mark as New
- Subscribe to RSS Feed
- Permalink
28 Sep 2023 03:38 PM
I completely forgot that I made this post. I was investigating what's going on😁
- Mark as New
- Subscribe to RSS Feed
- Permalink
28 Sep 2023 03:32 PM
The traffic drops in everywhere. When i go to network in browser, sometimes i don't see the agent beacon...
Creating new sessions in browser, sometimes it's not there. The configs are to monitor 100% of user sessions
- Mark as New
- Subscribe to RSS Feed
- Permalink
28 Sep 2023 03:36 PM
Sometimes, error 405 from different browsers like chrome, edge, opera, networks from different locations with or without vpn. Completely random.
Sometimes, just dessapear
- Mark as New
- Subscribe to RSS Feed
- Permalink
28 Sep 2023 03:36 PM
I've checked waf configs theres no logs, also in Dynatrace too
- Mark as New
- Subscribe to RSS Feed
- Permalink
28 Sep 2023 04:05 PM
I also get this errors above, like 100k per day. Maybe correlated with this? maybe not? ...
2023-09-28 07:07:23.730;BVLYNHGUIS;Unexpected errror in {Application Name};The controller for path '/rb_bf26736qil' was not found or does not implement IController.;http://{Application URL}.com.br/rb_bf26736qil?type=js3&sn=v_4_srv_1_sn_51344D2F76F8E05FF15451993FC2E3C2_perc_100000_ol_0_mul_1_app-3Aa8a1d4c97d4aae93_1
- Mark as New
- Subscribe to RSS Feed
- Permalink
14 Sep 2023 03:21 PM
You need to adjust the settings
The default is too sensitive and will spam you with problem tiles.
Since Davice can not handle weekends and public holidays you can use it only for outage monitoring with very low sensitivity.
- Mark as New
- Subscribe to RSS Feed
- Permalink
28 Sep 2023 03:53 PM
It's correctly adjusted. The big and real question/probllem is Why the agent javascript isn't in the application, thus generating these Unexpected Traffic errors besause rum is not been monitored.
- Mark as New
- Subscribe to RSS Feed
- Permalink
30 Sep 2023 02:35 PM
take a look on caching in CDN/LB - it could be that some instances have different content w/o JS snippet
This valid to AEM or similar systems with replication deployment


