- Dynatrace Community
- Dynatrace
- Ask
- Alerting
- Re: Create a list of unmonitored processes.
- Subscribe to RSS Feed
- Mark Topic as New
- Mark Topic as Read
- Pin this Topic for Current User
- Printer Friendly Page
- Mark as New
- Subscribe to RSS Feed
- Permalink
02 Apr 2024
07:57 PM
- last edited on
03 Apr 2024
08:05 AM
by
![]() MaciejNeumann
MaciejNeumann
How can I create a chart or metric to know which processes are not monitored by Dynatrace?
I'm facing the issue that suddenly there are processes not being monitored and they need to be monitored. I have to manually check each Dynatrace deployment.
And having a metric or a query, I can create alerts that notify us when a process stops being monitored.
Solved! Go to Solution.
- Mark as New
- Subscribe to RSS Feed
- Permalink
02 Apr 2024 10:46 PM
Hi Ellery,
Sorry I have just relaized that this is a DQL question for Saas...Maybe you can reuse some part of the Managed way.
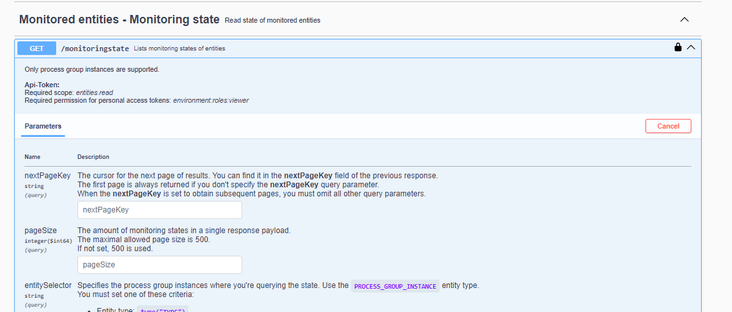
You can create a list about the PROCESS_GROUP_INSTANCE stauses in the Environment API v2 Monitored entities - Monitoring state endpoint:
In my case the example status is different...
query result:
I hope it helps.
Best regards,
Mizső
- Mark as New
- Subscribe to RSS Feed
- Permalink
03 Apr 2024 12:55 PM
Thank you very much for your help, but what I'm looking for is to have a grid or list with the processes that are not monitored or need to be restarted, so that I can add alarms to them and be notified. On the other hand, I don't want to have to check host by host if their processes are being monitored.
- Mark as New
- Subscribe to RSS Feed
- Permalink
08 May 2024 01:44 PM
Hello, good morning. Could someone help me with this issue? Yesterday, for some reason, one of the processes was left unmonitored, and we couldn't use the 'window.dyantrace()' command, which impacted us as the traces we are sending didn't arrive.
- Mark as New
- Subscribe to RSS Feed
- Permalink
08 May 2024 04:19 PM
So the endgame here would to be able to create an alert?
- Mark as New
- Subscribe to RSS Feed
- Permalink
08 May 2024 07:59 PM
Create an alert, a KPI that indicates the number of UNMONITORED processes, in order to regularize them. Any of these methods would serve us, but unfortunately, the only way I have found is to constantly check the deployment status and review the nodes and each of their processes.
- Mark as New
- Subscribe to RSS Feed
- Permalink
09 May 2024 03:51 AM
Hi @Ellery, If you are on SaaS as well as the new Platform - you could possibly leverage a workflow to generate an alert for the process that need a restart:
Here is an example of the 2 tasks that I have in a workflow that can possibly help alert on process that need to be restarted, one thing to preface is there since there is ingest and querying of data - there are costs associated with just running this and is really just meant to serve as an example.
I will upload a copy of the Workflow json so you can upload it into your environment.
1. DQL Query tile: to fetch a list of hosts - the results from this is to be used in a subsequent task
2. The second task is going to use a JavaScript action: The code fetches information about process group instances associated with a given hostname from Dynatrace. It checks the monitoring states of these instances, and if any state indicates a need for restart (e.g., contains "restart"), it logs information about the processes and ingests an event into Dynatrace indicating the need for restart, including the reason for restart as a property.
import { queryExecutionClient } from '@dynatrace-sdk/client-query';
import { monitoredEntitiesMonitoringStateClient } from "@dynatrace-sdk/client-classic-environment-v2";
import { actionExecution } from "@dynatrace-sdk/automation-utils";
import { EventIngest, EventIngestEventType, eventsClient } from '@dynatrace-sdk/client-classic-environment-v2';

async function getProcessInformation(hostname) {
  const timeout = 60;

  const query = `
      fetch dt.entity.process_group_instance
      | lookup [fetch dt.entity.host], sourceField:belongs_to[dt.entity.host], lookupField:id
      | filter lookup.entity.name == "${hostname}"
  `;

  const response = await queryExecutionClient.queryExecute({
    body: {
      query,
      requestTimeoutMilliseconds: timeout * 1000,
      fetchTimeoutSeconds: timeout,
    },
  });

  return response.result.records || [];
}

export default async function ({ action_execution_id }) {
  try {
    const pageSize = 500;
    const results = [];
    const actionExe = await actionExecution(action_execution_id);
    const hostname = actionExe.loopItem.hostname_variable["entity.name"];

    const processInfoList = await getProcessInformation(hostname);

    for (const processInfo of processInfoList) {
      const config = {
        entitySelector: `type("PROCESS_GROUP_INSTANCE"),entityId("${processInfo.id || ''}")`,
        nextPageKey: undefined,
        pageSize,
      };

      const monitoringStatesData = await monitoredEntitiesMonitoringStateClient.getStates(config);

      if (!monitoringStatesData || !monitoringStatesData.monitoringStates || monitoringStatesData.monitoringStates.length === 0) {
        continue;
      }

      const entityName = processInfo['entity.name'] || '';

      for (const state of monitoringStatesData.monitoringStates) {
        if (state.state.includes("restart")) {
          const result = {
            processId: processInfo.id || '',
            processName: entityName,
            monitoringState: state.state || '',
            severity: state.severity || '',
          };
          results.push(result);

          const processRestartEvent: EventIngest = {
            eventType: EventIngestEventType.CustomAlert,
            title: 'Process restart needed',
            entitySelector: `type("PROCESS_GROUP_INSTANCE"),entityId("${processInfo.id || ''}")`,
             properties: {
              'reason.for.restart':  state.state || ''
            },
          };
          await eventsClient.createEvent({ body: processRestartEvent });

          break;
        }
      }
    }

    console.log(results);

    return results;
  } catch (error) {
    console.error("Error:", error);
    return "Failed to fetch process information and monitoring states";
  }
}
This is how that would look like in Dynatrace
If all that you are trying to do is have this data displayed on a dashboard you can upload the dashboard json attached and see if that would work for your use case.


