- Dynatrace Community
- Dynatrace
- Ask
- Dashboarding
- Re: Filter by Management Zone using DQL
- Subscribe to RSS Feed
- Mark Topic as New
- Mark Topic as Read
- Pin this Topic for Current User
- Printer Friendly Page
- Mark as New
- Subscribe to RSS Feed
- Permalink
18 Dec 2023 05:21 PM
I have a widget on the new Dynatrace dashboard which displays the disk usage of servers. In our estate, we have filtered out servers through to their management zones. In the old dashboard format, you could filter servers by the management zone easily. However, in the newest one, there isn't such an option available so the next best thing is filtering through DQL. However, I cannot find such a command to do this. Any ideas?
Solved! Go to Solution.
- Mark as New
- Subscribe to RSS Feed
- Permalink
18 Dec 2023 06:18 PM
Hi @badgerfifteen
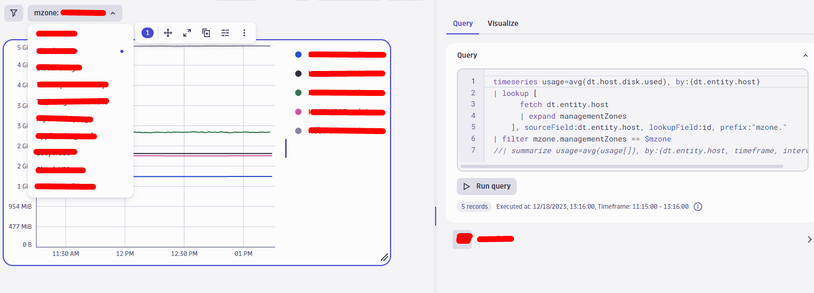
On the dashboard 3rd Gen, you can use variable as filters. And the DQL you can use could be this:
Variable:
fetch dt.entity.host
| fields managementZones
Dashboard:
timeseries usage=avg(dt.host.disk.used), by:{dt.entity.host}
| lookup [
      fetch dt.entity.host
      | expand managementZones
    ], sourceField:dt.entity.host, lookupField:id, prefix:"mzone."
| filter mzone.managementZones == $VARIABLE_NAME
Example:
- Mark as New
- Subscribe to RSS Feed
- Permalink
28 Mar 2024 09:06 PM
How do you use the query you've drafted above but for process group filtering by management zone? Below is the DQL query I have without filtering by management zone but would like the variable that I've created based on your above example to help filter out the process groups on each host in a specific mz:
Variable:
fetch dt.entity.process_group
| fields managementZones
| sort managementZones asc
DQL Query:
timeseries cpuUsage = avg(dt.process.cpu.usage), by:{host.name, dt.entity.process_group}
| fieldsAdd pgname = lookup([fetch dt.entity.process_group], lookupField:id, sourceField:dt.entity.process_group)[entity.name]
| sort arrayAvg(cpuUsage) desc
| limit 5- Mark as New
- Subscribe to RSS Feed
- Permalink
29 Mar 2024 06:03 PM
Hey @tonicbenn2023
You still can use your DQL for Mzone variables, but the DQL you should use for this scenario is:
timeseries cpuUsage = avg(dt.process.cpu.usage), by:{host.name, dt.entity.process_group}
| lookup [fetch dt.entity.process_group], lookupField:id, sourceField:dt.entity.process_group,prefix:"lookup.pg" //[entity.name]
| fieldsAdd lookup.pgentity.name,mzone= lookup.pgmanagementZones
| expand mzone
| filter toString(mzone)==$VARIABLE_MZONE
| sort arrayAvg(cpuUsage) desc
| limit 5
Result:
Regards,
- Mark as New
- Subscribe to RSS Feed
- Permalink
01 Apr 2024 02:38 PM
Amazing! This worked, thank you :-)!
- Mark as New
- Subscribe to RSS Feed
- Permalink
23 Feb 2024 06:43 PM - edited 23 Feb 2024 06:44 PM
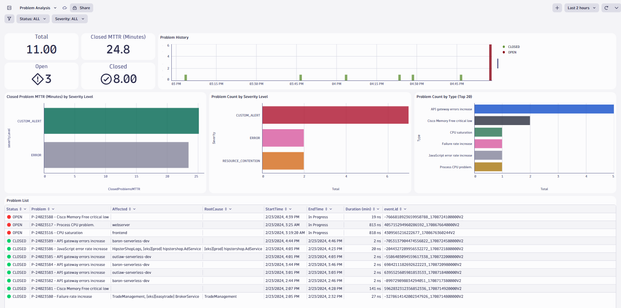
@cesarsaravia Can I do something similar to filter my open issues by management zone?
- Mark as New
- Subscribe to RSS Feed
- Permalink
23 Feb 2024 10:01 PM
Hi @RPbiaggio
Here you have a list of dashboards created for GEN3
GitHub - TechShady/Dynatrace-Dashboards-Gen3: This repo provides Business Grade Dashboards for Dynat...
Also, here you have a Zip with the DQL for the problem analysis. You should have to modify it in order to get the MZone filter.
- Mark as New
- Subscribe to RSS Feed
- Permalink
26 Feb 2024 12:38 PM
@cesarsaravia Hi!!
Thanks for the response. I was already looking at this same dashboard. I still haven't been able to get data collection to work when I include management zones.
- Mark as New
- Subscribe to RSS Feed
- Permalink
26 Feb 2024 04:23 PM
@cesarsaraviaAn example of what I mentioned above. I got a ready-made template and I'm just trying to include the management zone, to be shown, but it returns null.
fetch events
| fieldsAdd tags = entity_tags, zonas = affected_entities.management_zones.names
| expand tags
| expand zonas
| filter event.kind == "DAVIS_PROBLEM" //and zonas == "FS: Aquisição Digital"
| sort timestamp desc

// Lookup for affected_entity_ids and root_cause_entity_id Start
| expand affected_entity_ids
| expand root_cause_entity_id
| lookup [fetch dt.entity.service], sourceField:affected_entity_ids, lookupField: id, prefix:"lookup.affected.entity.services"
| lookup [fetch dt.entity.service], sourceField:root_cause_entity_id, lookupField: id, prefix:"lookup.rootcause.entity.services"
| lookup [fetch dt.entity.process_group_instance], sourceField:affected_entity_ids, lookupField: id, prefix:"lookup.affected.entity.pgi"
| lookup [fetch dt.entity.process_group_instance], sourceField:root_cause_entity_id, lookupField: id, prefix:"lookup.rootcause.entity.pgi"
| lookup [fetch dt.entity.application], sourceField:affected_entity_ids, lookupField: id, prefix:"lookup.affected.entity.applications"
| lookup [fetch dt.entity.application], sourceField:root_cause_entity_id, lookupField: id, prefix:"lookup.rootcause.entity.applications"
| lookup [fetch dt.entity.mobile_application], sourceField:affected_entity_ids, lookupField: id, prefix:"lookup.affected.entity.mobile"
| lookup [fetch dt.entity.mobile_application], sourceField:root_cause_entity_id, lookupField: id, prefix:"lookup.rootcause.entity.mobile"
| lookup [fetch dt.entity.custom_application], sourceField:affected_entity_ids, lookupField: id, prefix:"lookup.affected.entity.customapplication"
| lookup [fetch dt.entity.custom_application], sourceField:root_cause_entity_id, lookupField: id, prefix:"lookup.rootcause.entity.customapplication"
| lookup [fetch dt.entity.cloud_application], sourceField:affected_entity_ids, lookupField: id, prefix:"lookup.affected.entity.cloudapplication"
| lookup [fetch dt.entity.cloud_application], sourceField:root_cause_entity_id, lookupField: id, prefix:"lookup.rootcause.entity.cloudapplication"
| lookup [fetch dt.entity.synthetic_test], sourceField:affected_entity_ids, lookupField: id, prefix:"lookup.affected.entity.synthetictest"
| lookup [fetch dt.entity.synthetic_test], sourceField:root_cause_entity_id, lookupField: id, prefix:"lookup.rootcause.entity.synthetictest"
| lookup [fetch dt.entity.http_check], sourceField:affected_entity_ids, lookupField: id, prefix:"lookup.affected.entity.httpcheck"
| lookup [fetch dt.entity.http_check], sourceField:root_cause_entity_id, lookupField: id, prefix:"lookup.rootcause.entity.httpcheck"
| lookup [fetch dt.entity.kubernetes_cluster], sourceField:affected_entity_ids, lookupField: id, prefix:"lookup.affected.entity.kubernetescluster"
| lookup [fetch dt.entity.kubernetes_cluster], sourceField:root_cause_entity_id, lookupField: id, prefix:"lookup.rootcause.entity.kubernetescluster"
| lookup [fetch dt.entity.host], sourceField:affected_entity_ids, lookupField: id, prefix:"lookup.affected.entity.hosts"
| lookup [fetch dt.entity.host], sourceField:root_cause_entity_id, lookupField: id, prefix:"lookup.rootcause.entity.hosts"
| lookup [fetch dt.entity.custom_device], sourceField:affected_entity_ids, lookupField: id, prefix:"lookup.affected.entity.customdevices"
| lookup [fetch dt.entity.custom_device], sourceField:root_cause_entity_id, lookupField: id, prefix:"lookup.rootcause.entity.customdevices"
| lookup [fetch dt.entity.hypervisor], sourceField:affected_entity_ids, lookupField: id, prefix:"lookup.affected.entity.hypervisor"
| lookup [fetch dt.entity.hypervisor], sourceField:root_cause_entity_id, lookupField: id, prefix:"lookup.rootcause.entity.hypervisor"
| lookup [fetch dt.entity.environment], sourceField:affected_entity_ids, lookupField: id, prefix:"lookup.affected.entity.environment"
// Lookup for affected_entity_ids and root_cause_entity_id End


| summarize {zonas = takeFirst(zonas),startTime = takeFirst(event.start),
            endTime = takeFirst(event.end),
            problemClosedDuration = takeFirst(resolved_problem_duration),
            status = takeFirst(event.status),
            event.name = takeFirst(event.name),
            severityLevel = takeFirst(event.category),
            affected = takeFirst(affected_entity_ids),
            rootCause = takeFirst(root_cause_entity_id),
            dt.davis.is_duplicate = takeFirst(dt.davis.is_duplicate),
            affectedServices = collectDistinct(lookup.affected.entity.servicesentity.name),
            affectedPGI = collectDistinct(lookup.affected.entity.pgientity.name),
            affectedApplications = collectDistinct(lookup.affected.entity.applicationsentity.name),
            affectedMobile = collectDistinct(lookup.affected.entity.mobileentity.name),
            affectedCustomApplication = collectDistinct(lookup.affected.entity.customapplicationentity.name),
            affectedCloudApplication = collectDistinct(lookup.affected.entity.cloudapplicationentity.name),
            affectedSyntheticTest = collectDistinct(lookup.affected.entity.synthetictestentity.name),
            affectedEntityZone = takeFirst(affected_entity.management_zones.names),
            affectedHttpCheck = collectDistinct(lookup.affected.entity.httpcheckentity.name),
            affectedKubernetesCluster = collectDistinct(lookup.affected.entity.kubernetesclusterentity.name),
            affectedHosts = collectDistinct(lookup.affected.entity.hostsentity.name),
            affectedCustomDevices = collectDistinct(lookup.affected.entity.customdevicesentity.name),
            affectedHypervisor = collectDistinct(lookup.affected.entity.hypervisorentity.name),
            affectedEnvironment = collectDistinct(lookup.affected.entity.environmententity.name),
            rootCauseServices = collectDistinct(lookup.rootcause.entity.servicesentity.name),
            rootCausePGI = collectDistinct(lookup.rootcause.entity.pgientity.name),
            rootCauseApplications = collectDistinct(lookup.rootcause.entity.applicationsentity.name),
            rootCauseMobile = collectDistinct(lookup.rootcause.entity.mobileentity.name),
            rootCauseCustomApplication = collectDistinct(lookup.rootcause.entity.customapplicationentity.name),
            rootCauseSyntheticTest = collectDistinct(lookup.rootcause.entity.synthetictestentity.name),
            rootCauseHttpCheck = collectDistinct(lookup.rootcause.entity.httpcheckentity.name),
            rootCauseHosts = collectDistinct(lookup.rootcause.entity.hostsentity.name),
            rootCauseCustomDevices = collectDistinct(lookup.rootcause.entity.customdevicesentity.name),
            event.id = takeFirst(event.id)},
            by:{display_id}
| filter `dt.davis.is_duplicate` == false
| fieldsAdd currentTime = toTimestamp(now())
| fieldsAdd status = if((status == "ACTIVE"),"OPEN",
                else:if((status == "CLOSED"), "CLOSED"))

| fields zonas,Status = if((status == "OPEN"),"🔴 OPEN",
                  else:if((status == "CLOSED"),"🟢 CLOSED")),
         Problem = concat(display_id," - ",event.name),
         Severity = severityLevel,
         Type = (event.name),
         AffectedCount = arraySize(arrayRemoveNulls(arrayConcat(affectedApplications,affectedMobile,affectedCustomApplication,affectedCloudApplication,affectedSyntheticTest,affectedHttpCheck,affectedServices,affectedPGI,affectedKubernetesCluster,affectedHosts,affectedHypervisor,affectedCustomDevices,affectedEnvironment))),
         Affected = arrayRemoveNulls(arrayConcat(zonas,affectedApplications,affectedMobile,affectedCustomApplication,affectedCloudApplication,affectedSyntheticTest,affectedHttpCheck,affectedServices,affectedPGI,affectedKubernetesCluster,affectedHosts,affectedHypervisor,affectedCustomDevices,affectedEnvironment)),
         RootCause = arrayRemoveNulls(arrayConcat(rootCauseServices,rootCauseHosts)),
         StartTime = startTime,
         EndTime =  if((status == "OPEN"),"In Progress",
                    else:if((status == "CLOSED"),endTime)),
         `Duration (min)` = if((status == "CLOSED"),problemClosedDuration/60000000000,
                   else:if((status == "OPEN"), toLong(currentTime-startTime)/60000000000)),
         event.id
| sort StartTime, direction:"descending"
| sort Status, direction:"ascending"
- Mark as New
- Subscribe to RSS Feed
- Permalink
27 Feb 2024 10:59 PM
Hi @RPbiaggio
After all the lookups, you must add this code and then get the right lookup.affected.entity....
| fieldsAdd zonas = coalesce(lookup.affected.entity.hostsmanagementZones, lookup.affected.entity.hypervisormanagementZones,lookup.affected.entity.servicesmanagementZones)Example:


