- Dynatrace Community
- Dynatrace
- Ask
- Open Q&A
- Re: Distributed trace Duration doesn't add up
- Subscribe to RSS Feed
- Mark Topic as New
- Mark Topic as Read
- Pin this Topic for Current User
- Printer Friendly Page
- Mark as New
- Subscribe to RSS Feed
- Permalink
03 Apr 2024
07:22 AM
- last edited on
03 Apr 2024
10:51 AM
by
![]() Michal_Gebacki
Michal_Gebacki
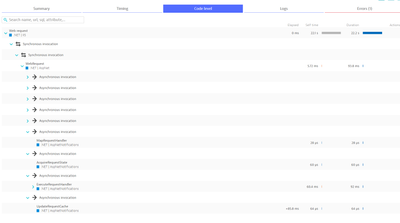
I'm trying to understand why my IIS / .NET request response time is taking so long. In this case, it reflects 22.2s response time and duration, but the elapsed time of the last call (UpdateRequestCache) does not reflect 22+ seconds. Is there a way to tell where the 22s is taking place? Before or after the code execution?
Thanks!
Gary
Solved! Go to Solution.
- Labels:
-
distributed traces
- Mark as New
- Subscribe to RSS Feed
- Permalink
03 Apr 2024 08:40 AM
Hi.
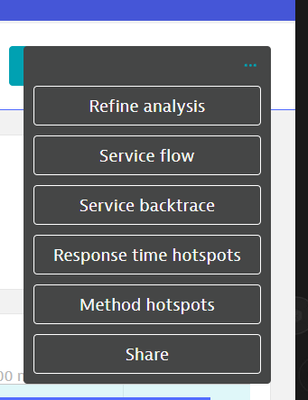
In the top right (3 dots ...) , you can use response time hotspots and method hotspots.
- Mark as New
- Subscribe to RSS Feed
- Permalink
03 Apr 2024 09:09 AM
I have another question here
What a refine is doing exactly?
- Mark as New
- Subscribe to RSS Feed
- Permalink
03 Apr 2024 01:40 PM - edited 03 Apr 2024 01:42 PM
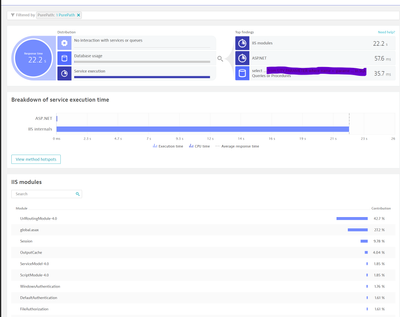
Thanks for the reply. I tried Response time hotspots and it showed me this but I'm not sure how to get to dig further. I see it attributes it to UrlRoutingModule which makes sense as this is a WebApi application, but it's still odd that almost all of the Duration of 22 seconds isn't within the Controller code seen being executed in the "Code" page. The duration of items in the Code page make up less than a second but can't tell where the rest of time is taken.
Does Dynatrace have any visibility into what happens before and after what is invoked in the Controller and seen in the Code level analysis?
- Mark as New
- Subscribe to RSS Feed
- Permalink
03 Apr 2024 01:48 PM
click on the View method hotspots and check it.


